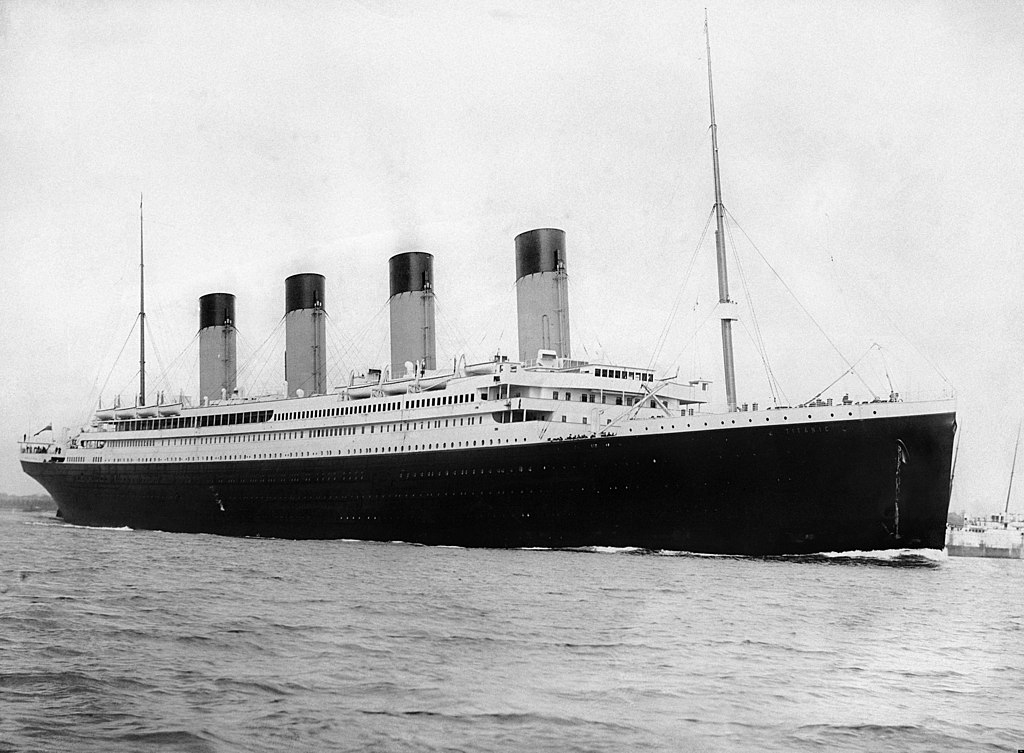
The sinking of the RMS Titanic is one of the most infamous shipwrecks in history. On April 15, 1912, during her maiden voyage, the Titanic sank after colliding with an iceberg, killing 1502 out of 2224 passengers and crew. This sensational tragedy shocked the international community and led to better safety regulations for ships. One of the reasons that the shipwreck led to such loss of life was that there were not enough lifeboats for the passengers and crew. Although there was some element of luck involved in surviving the sinking, some groups of people were more likely to survive than others, such as women, children, and the upper-class.
The problem statement was to complete the analysis of what sorts of people were likely to survive and apply the machine learning tools to predict which passengers survived the tragedy. The Kaggle Titanic problem page can be found here. The full solution in python can be found here on github. The data in the problem is given in two CSV files, test.csv and train.csv. The variable used in the data and their description are as follows
| Variable Name | Definition |
|---|---|
| survival | If an individual survived the tragedy or not |
| pclass | Ticket class |
| Name | Name of the individual |
| sex | Sex |
| Age | Age in years |
| sibsp | # of siblings/spouses aboard the Titanic |
| parch | # of parents/children aboard the Titanic |
| ticket | Ticket Number |
| fare | Passenger fare |
| cabin | Cabin Number |
| embarked | Port of Embarkation |
The target variable here is Survived which takes the value 0 or 1. Since the target value takes the binary values we can say that the this is an example of classification problem. We have to train the model using train.csv and predict the outcomes using test.csv and submit the predictions on kaggle. At first we will read the data from CSV file using the pandas library in python, for that we have to import pandas library. The data is loaded in pandas dataframe format. We can see how the data looks like using dataframe.head() command. We can also see the columns using dataframe.columns command. We can check the number of rows and columns of the dataframe using the dataframe.shape command.
import pandas as pd
dataframe=pd.read_csv('train.csv')
print(dataframe.head(10))
print(dataframe.columns)
print(dataframe.shape)
The ‘Name’ variable present here contains the full name of the person. In this format the ‘Name’ variable is not useful for us as almost all the entries here will be unique and that would not help in our prediction. We can make this useful by trimming and partitioning the string to get the title and first name of the individual.
dataframe['Name']=dataframe['Name'].str.partition(',')[2]
dataframe['Name']=dataframe['Name'].str.partition(',')[0]
We can check the values taken by a variable by values_count() function. We can also check whether a variable contains NaN(Not a Number) values or not. After checking value_counts for age variable we found out that the age variable contained NaN values. We can wither drop the NaN values using dropna() function or we can impute the values. In this example we will impute the missing values using MICE(Multiple Imputation by Chained Equations). To use MICE function we have to import a python library called ‘fancyimpute’. Mice uses the other variables to impute the missing values and iterate it till the value converges such that our imputed value balances the bias and variance of that variable.
print(dataframe['Age'].value_counts(dropna=False)
from fancyimpute import MICE
solver=MICE()
Imputed_dataframe=solver.complete(dataframe.values)
Since this is a classification problem we can solve it by methods such as Logistic Regression, Decision Tree, Random Forest etc. Here we will use Random Forest to solve this problem. Variables present here are categorical and continuous. Some of the categorical variables are in the string format. So we have to first change that in the integer categorical format so that we can feed the data directly for our model to learn. We can use factorize function from pandas library to do this.
cols=['Name','Ticket','Pclass','Fare','Embarked','Cabin']
for x in cols:
    a=pd.factorize(dataframe[x])
    dataframe[x]=a[0]
We can create an addition variable named ‘family_size’ using the variables ‘parch’ and ‘sibsp’. Now our data is ready and we can train our model using the data. We will first divide the data into target variables and and features as Y and X. We will train the model using X and Y.
dataframe['family_size']=dataframe['SibSp'] + dataframe['Parch'] + 1
y=dataframe[['Survived']].values
x=dataframe.values
import numpy as np
x=np.delete(dataframe,0,axis=1)
model=RandomForestClassifier(n_estimators=100,criterion='gini',max_depth=10,min_samples_split=10)
model=model.fit(x,y)
Now our model has been trained. We can use this model to predict whether a person survived the tragedy or not. Now we will read the test.csv file and use the variables present as test features for prediction.
test=pd.read_csv('test.csv')
test['Name']=test['Name'].str.partition(',')[2]
test['Name']=test['Name'].str.partition('.')[0]
cols=['Name','Ticket','Pclass','Fare','Embarked','Cabin']
for x in cols:
    a=pd.factorize(test[x])
    test[x]=a[0]
test_features=test.values
my_prediction = model.predict(test_features)
Now we have our predictions in ‘my_prediction’ variable. Now we are ready to submit the solution to kaggle. For kaggle submission a specific format is given for problems. We will write our solution in a CSV file in suitable format which we can submit at kaggle.
PassengerId =np.array(test["PassengerId"]).astype(int)
my_solution = pd.DataFrame(my_prediction, PassengerId, columns = ["Survived"])
my_solution.to_csv("my_solution.csv", index_label = ["PassengerId"])
Now we have our solution in a CSV file ‘my_solution.csv’. We can submit this file on to kaggle submission page and check our accuracy.